Teaching
My teaching focuses on fostering data literacy through hands-on learning experiences. I have developed courses across a spectrum of quantitative sciences, empowering students to use mathematics, statistics, and programming to discover insights in data and solve real-world problems. Information about my teaching philosophy can be found in my teaching statement. Recently, my work has concentrated on data visualization, data science, and quantitative reasoning.
Data Visualization
Data visualization is the practice of representing data graphically to make it accessible, understandable, and useful. It integrates principles from data science, computer science, and psychophysics to create clear, concise, and effective visualizations that build awareness and communicate patterns within the data.
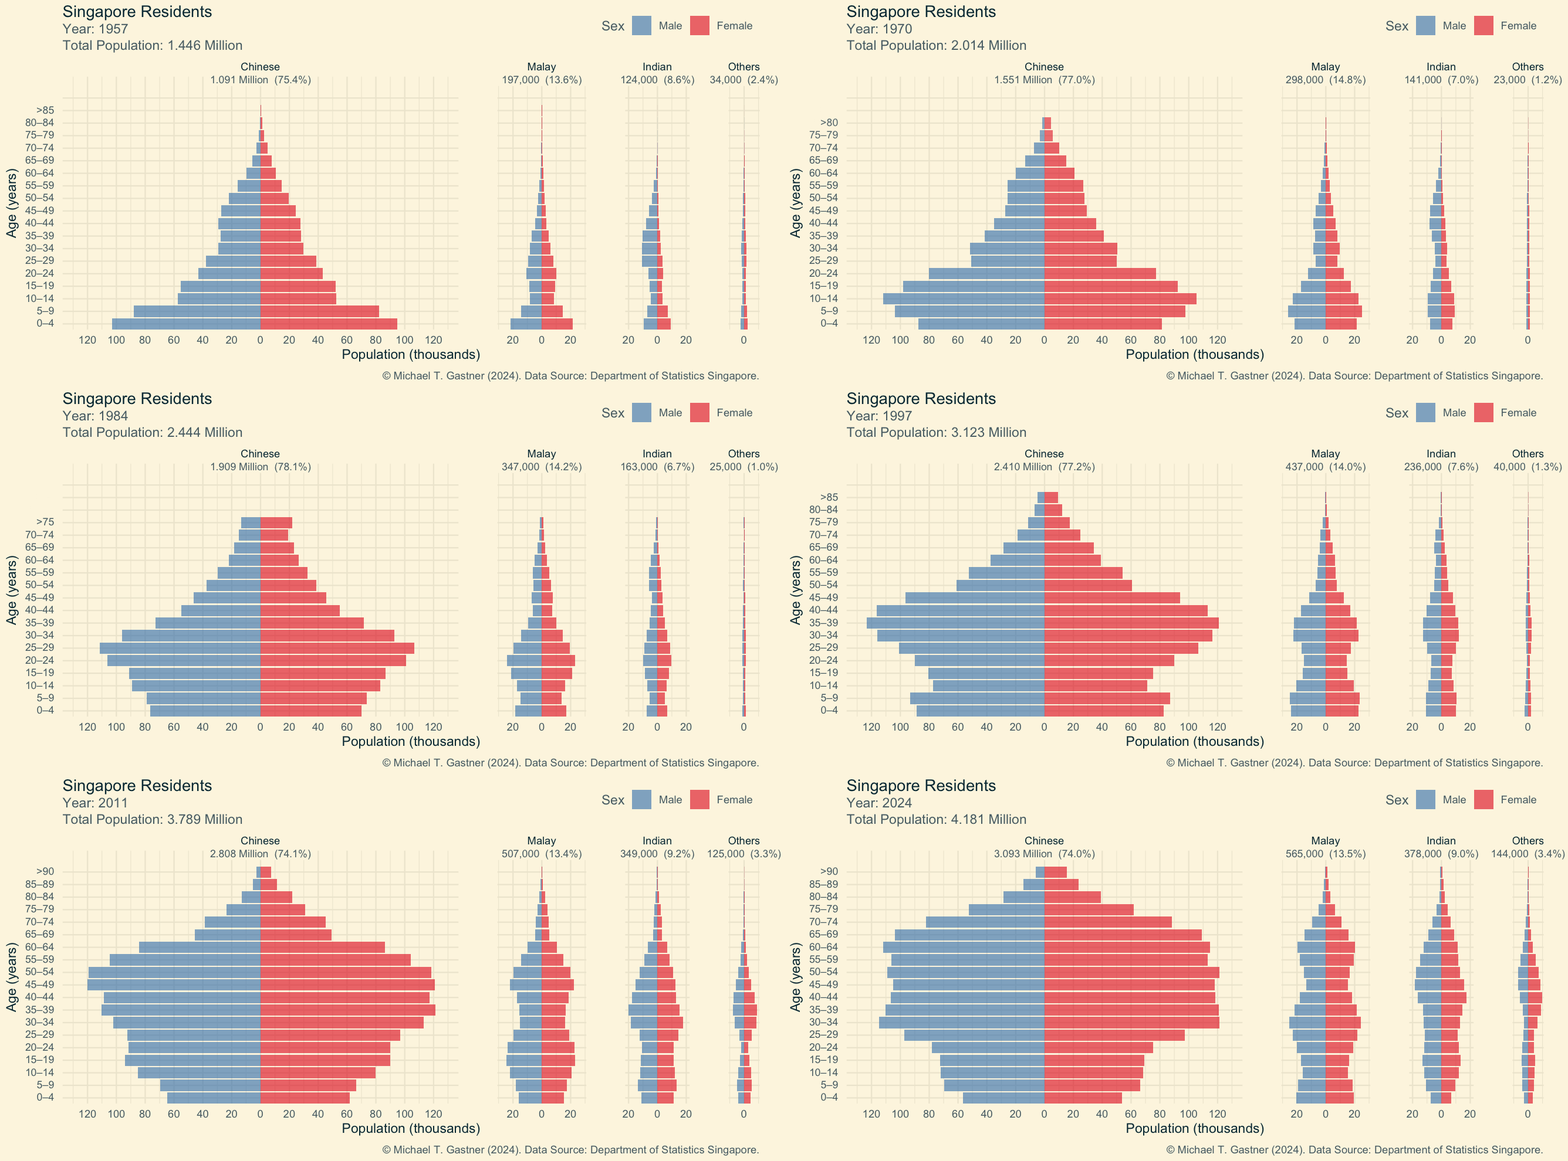
My pedagogical approach to data visualization is based on the “grammar of graphics,” a programming paradigm that simplifies the process of turning data into meaningful visual representations. Students will develop visualization skills through programming assignments and projects. Throughout the module, students will critically evaluate data visualization, such as infographics found in the news media. By the end of the module, students should be able to produce visualizations that are informative, communicate data effectively without misrepresentation, and are aesthetically pleasing. Figure 1 exemplifies one of the outcomes that students are tasked to create.
- Gastner, M. T. (2023) Teaching data visualisation and basic map-making skills at a liberal arts college. Cartography and Geoinformation (Kartografija i Geoinformacije), 22(39), pp. 43–59. Available at https://doi.org/10.32909/kg.22.39.3 and the author’s website.
- Gastner, M. T. (in preparation) Data visualization using R, RStudio, and the tidyverse. CRC Press.
Data Science
Data science has transformed human capabilities for processing and understanding information through the application of techniques from mathematics, statistics, and computer science to real-life scenarios. This course introduces key methods in data science, equipping students with the tools to uncover patterns, make predictions, and derive insights. Through a combination of statistical theory and computational techniques, students gain hands-on experience in extracting meaningful information from complex data sets.
Coursework includes practical programming assignments on topics such as exploratory data analysis, hypothesis testing, regression models, and machine learning methods, including decision trees and clustering. Figure 2 illustrates one of the course topics: the use of association rules to identify products commonly purchased together from an online grocery service. By the end of the course, students will be proficient in applying data science techniques to solve a wide range of problems, using the R Tidyverse programming principle to analyze data effectively and make informed decisions.
Data Structures and Algorithms
Modern computing relies on the theory of abstract data types and algorithms for representing and processing information. In this module, students learn how to reason about computational performance (e.g., running time and memory requirements) and how to choose data structures that support efficient algorithms. Core topics include arrays, linked lists, stacks, queues, hash tables, trees, and graphs, alongside standard algorithmic techniques such as sorting, divide-and-conquer, disjoint-set operations, and shortest-path algorithms. The module combines online tutorials with supervised C++ programming labs and assesses conceptual mastery through closed-book examinations and open-resource programming projects.
I am currently developing the Data Structures Animators web application that let students step through operations and inspect intermediate states.
Quantitative Reasoning
Quantitative Reasoning is the ability to apply logical and statistical thinking to analyze data, draw meaningful conclusions, and make informed decisions. Designed as part of the core curriculum across disciplines, this course strengthens students’ critical thinking and problem-solving skills by teaching them how to interpret, evaluate, and communicate quantitative information effectively. Students develop the ability to scrutinize empirical claims, collect relevant data, support arguments with numerical evidence, and communicate results with clarity and professionalism.
The course covers foundational concepts of data science, including descriptive statistics, probability distributions, hypothesis testing, and regression analysis. Students gain hands-on experience with statistical software to analyze data and interpret findings accurately. They also develop the skills needed to present their results using clear language, well-structured arguments, and visual tools such as graphs.
A practical example from the course, illustrated in Figure 3, explores the relationship between a country’s wealth and life expectancy, showcasing how quantitative analysis can reveal insights into complex global patterns.
- Quantitative Reasoning YouTube Channel including video tutorials for R.
